Show Image Histogram
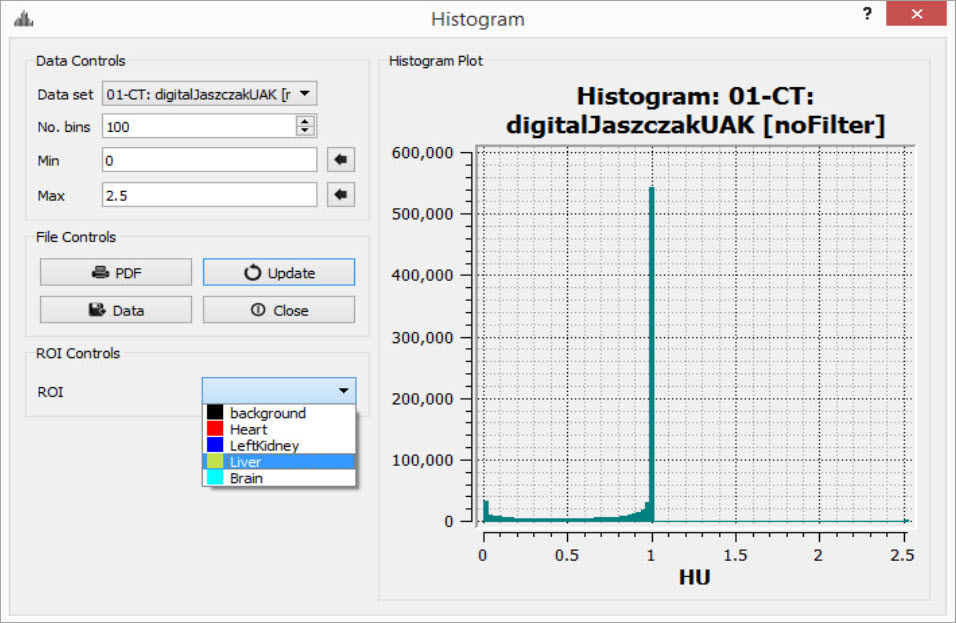
To view a histogram of the image or any subset of the image determined by an ROI, click the Show Histogram  button. Choose the image used to generate the histogram by selecting it from the Data Set drop-down menu. The portion of the image contributing to the histogram can be set under the ROI Controls by selecting an ROI from the drop-down menu.
Set Quantification Table Columns
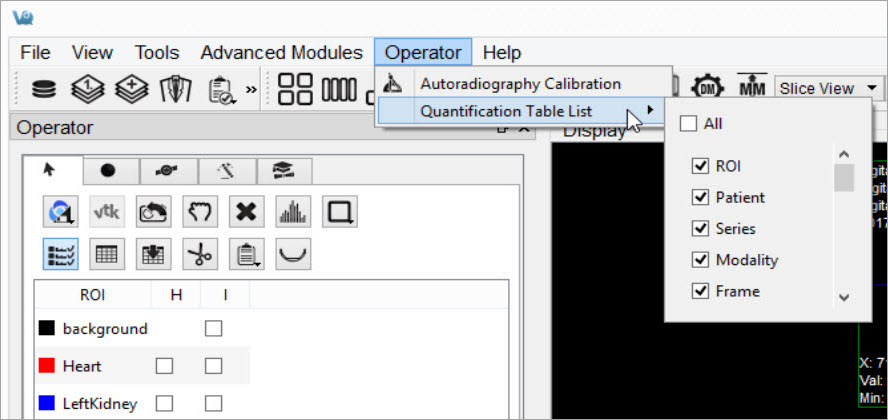
To determine which quantitative fields will be displayed in the quantification table and stored to the iPACS, if applicable, go to the Operator tab on the main menu, then select Quantification Table List.
The available quantification values are described below:
| Option | Description |
|---|---|
| ROI | Name of the ROI. You can left-click this field to enter comments. |
| Patient | Patient’s name for the current study. |
| Series | Specific data set in the study from which the data was calculated. |
| Modality | Modality from which the data values for the row were calculated. |
| Color | Color of the ROI as drawn in the display. |
| Voxels | Total number of voxels contained in the selected ROI. |
| Volume | Volume of the selected ROI in units of cubic millimeters. |
| Mean | Arithmetic mean of values of voxels contained in the ROI. |
| StdDev | Standard Deviation of values of voxels contained in the ROI. |
| Min | Minimum value of all voxels contained in the ROI. |
| Max | Maximum value of all voxels contained in the ROI. |
| Median | Median value of all voxels contained in the ROI. |
| Sum | Sum of all voxels contained in the ROI, sometimes interchangeable with ‘Uptake’ |
| Unit | Unit of voxels in the selected dataset. |
| Conc 10% | Concentration (mean/volume) of the 10th Percentile of voxels contained in the ROI. |
| Conc 50% | Concentration (mean/volume) of the 50th Percentile of voxels contained in the ROI. |
| Conc Peakregion | Concentration (mean/volume) of the 3x3x3 cube of voxels with the greatest mean of all 3x3x3 cubes of voxels contained within the ROI. Referred to below as Highest-uptake region. |
| Conc Peakmax | Concentration (mean/volume) of the 3x3x3 cube of voxels that has at its center the maximum voxel of the voxels contained in the ROI. Referred to below as SUVmax. |
| Conc Max | Concentration (mean/volume) of the maximum voxel of the voxels contained in the ROI. |
| Conc | Concentration (mean/volume) of all the voxels contained in the ROI. |
| Conc Unit | Unit of voxels in the selected data set over volume (mm3). |
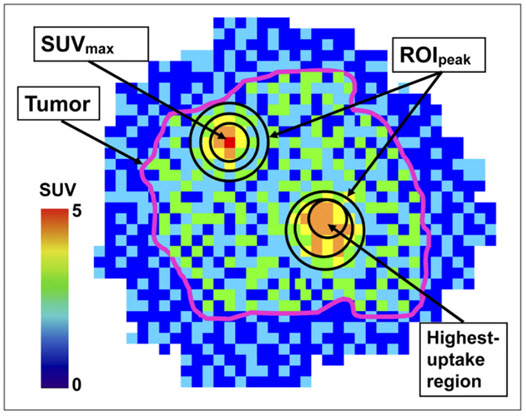
“Impact of the Definition of Peak Standardized Uptake Value on Quantification of Treatment Response”. Vanderhoek, et al. J Nuclear Medicine, 2012. Link.
Show Quantification Table
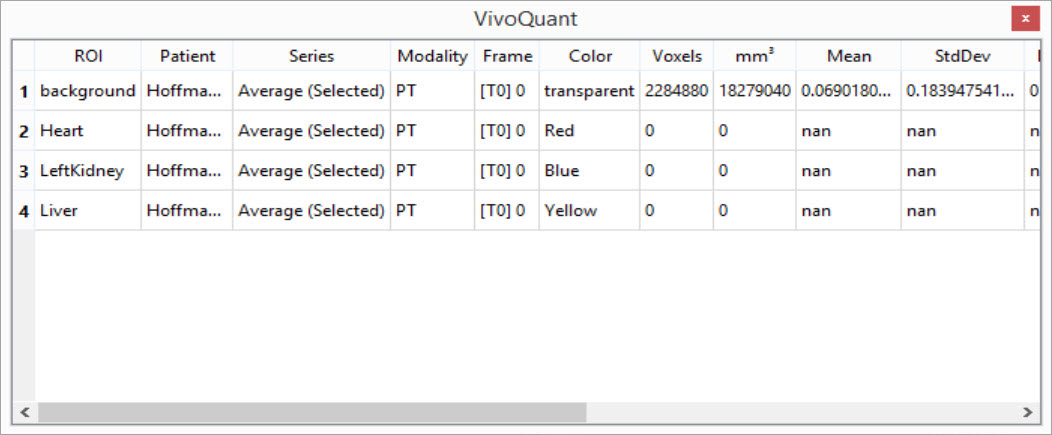
To display the quantification table, including all existing ROIs, click the Show Table button  .
.
Export Quantification Table to Disk
To export the quantification table to disk as a comma-separated values (.csv) file, click the Export Table button  .
.