The Data Browser provides access to DICOM servers, local folders, and iPACS repositories. It allows files to be imported, exported, managed, and opened in VivoQuant or external tools for viewing and analysis.
Getting There
There are three methods to access the Data Browser. The first method is to click the ![]() icon in the Main Window. The second method is to go to File > Data Browser.
icon in the Main Window. The second method is to go to File > Data Browser.
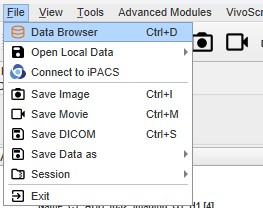
The third method is to use the keyboard shortcut Ctrl+D. For more on keyboard shortcuts in VivoQuant, see Keyboard Shortcuts.
Function
The Data Browser’s main window is split into five sections:
| Section | Description |
|---|---|
| Repository | Displays the currently selected repository and its projects |
| Filter | Provides options for filtering the data displayed in the Study Browser |
| Study Browser | Displays the data found in the selected repository |
| Loading Data | Provides options for loading data from the Study Browser into VivoQuant |
| Progress | Displays the progress of the current operation |
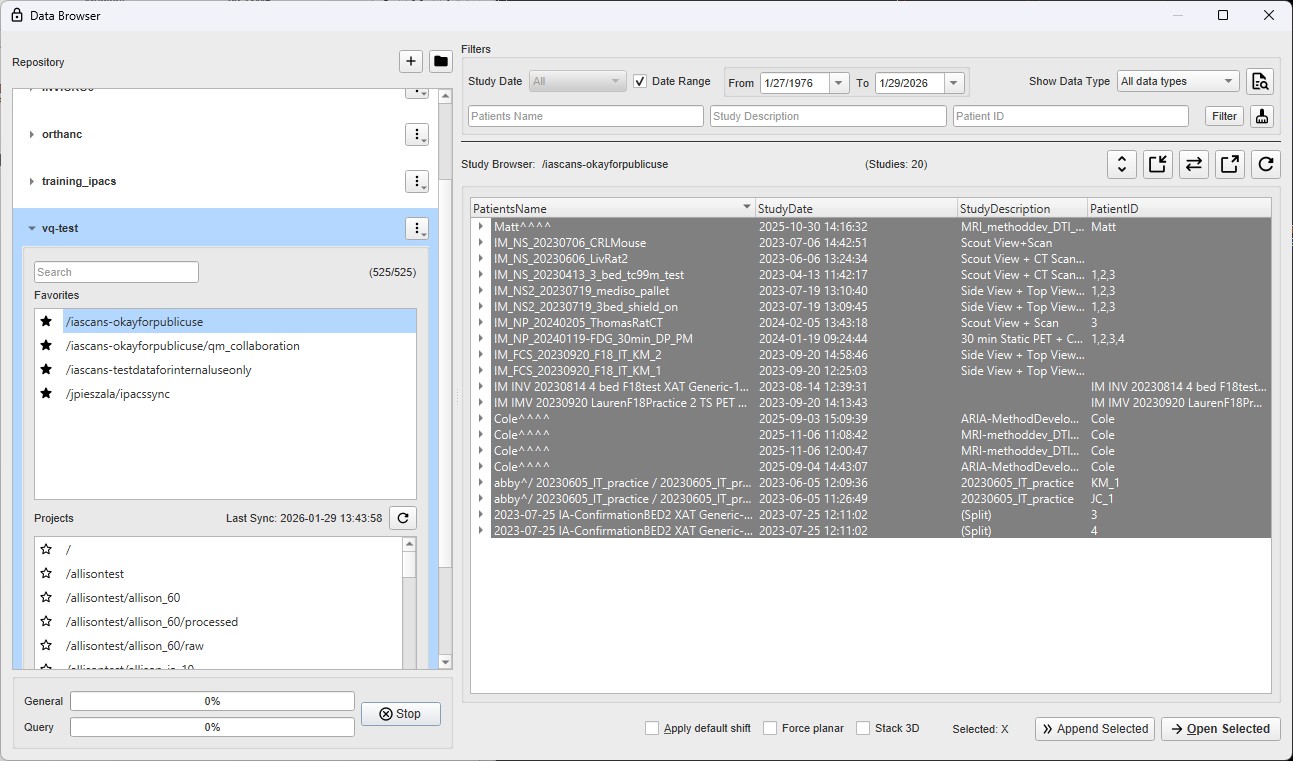
Repository
The Repository section displays all the currently configured repositories. See DICOM Configuration for more information on configuring your repositories. After proper configuration this section will be your starting point for switching between repositories and managing projects. Projects will either be iPACS projects or local folders depending on the type of repository.
Once a repository is configured it will have an expandable entry in this UI pane. Clicking on the repository name will expand/collapse the view of the internal projects. Once expanded the user will have access to manage the projects contained within the repository. Project favoriting and searching are available to help the user quickly find and and get back to projects of interest. In order to speed up a user’s workflow, the list of projects is cached locally after the first time a repository is accessed. It is at the behest of the user to refresh this cache should they believe the project list has changed on the server side. This can be done by clicking the refresh button next the last sync time display.
The search filter allows users to reduce the project list to more easily search for a desired project. There are three ways to filter the project list, as described in the following table:
| Filter Option | Description | Example |
|---|---|---|
| word | Reduces project list to all projects that contain the given word in their path. | Type exampledata in the projects filter to reduce the projects list to all projects with the word exampledata in their path. |
| !word | Reduces project list to all projects that do not contain the given word in their path. | Type !exampledata in the projects filter to reduce the projects list to all projects that do not contain exampledata in their path. |
| ®exp | Reduces project list to all projects that match the given regular expression. | An example of a commonly used regular expression is the choice operator “|”, which matches either the expression before or the expression after the operator. For example, if the user types &exampledata|test in the projects filter, the project list will reduce to all projects that have the word exampledata and all projects with the word test in their path. |
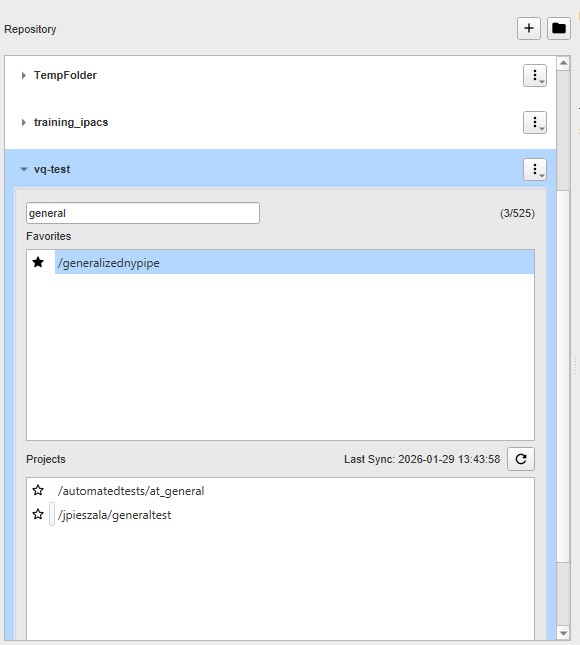
Press enter on the keyboard to apply the filter. The filtered number of projects over the total number of projects is displayed. For example, the image below displays 3 out of 525 projects with the word general in their path, 1 of which have already been favorited.
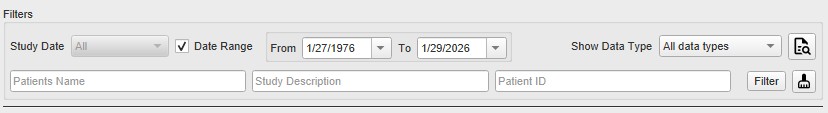
Filter
As the database grows, the Filter tool becomes useful for sifting through studies to find just the right one. Options for filtering include Patient’s Name, Patient ID, Study Description, and Study Date.
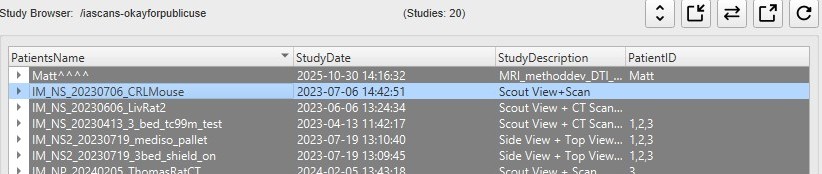
Study Browser
The Study Browser displays the data found in the selected Repository/Project. The Filter options can be used to limit the data displayed in the Study Browser. Data may be opened with either the Open or Append buttons or right click context menu.
The Open button will unload data currently open in VivoQuant and load the highlighted data as Reference, Input 1, Input 2, etc. The Append button will leave the currently loaded data unchanged and append the highlighted data. This appended data may be accessed via the Data Manager.
At the top level, multiple files may be opened into the Main Window simultaneously. The Data Browser recognizes the files in the study and opens them accordingly, setting the CT image as the Reference. If extra data is found, the Data Browser provides the message: Ignoring extra data sets.
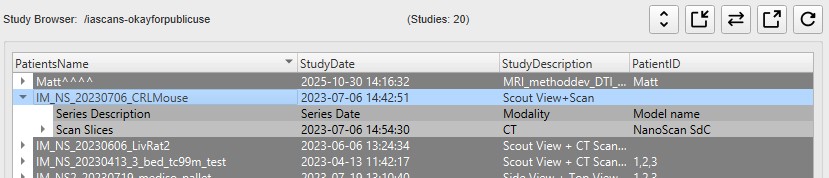
At the next level, single data sets from a study may be selected for viewing.
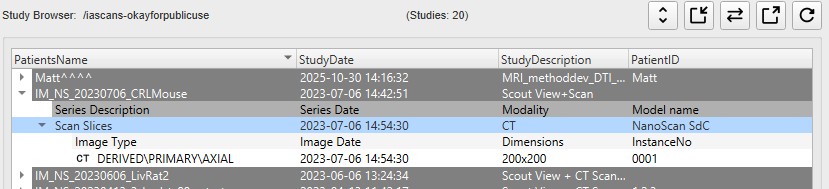
This nested structure continues, depending on the format in which the data is saved. For example, for CT data saved in Single Frame format, single slices may be selected for viewing.
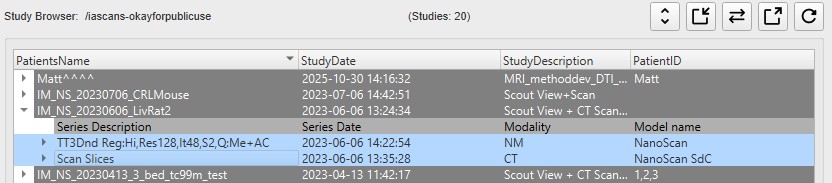
Ctrl-click and Shift-click options are also implemented to simplify data selection. This feature is useful for selecting multiple subsets of studies for both loading them into the Main Window and exporting them.
Study Browser Toolbar
The Study Browser Toolbar provides some basic information on the current project like project name and number of studies. It also provides quick access to commonly used functions like expanding/collapsing the study level, importing/exporting data, fetching meta data, and refreshing the current results.

| Icon | Function | Description |
|---|---|---|
| Expand | Expand / Collapse the Study Level | |
| Import | Allows data from a local folder to be imported into another local folder, database, or iPACS repository. | |
| Fetch | Fetch all the meta data for the project. | |
| Export | Allows data to be copied to a local folder. | |
| Refresh | Refresh the current Study Browser results. |
Right-Click function
The right-click function of the Data Browser is used as a shortcut for a number of common operations. Right click menu works on the entirety of the selected items in the Study Browser, whether that be a single file, series, study, or project.
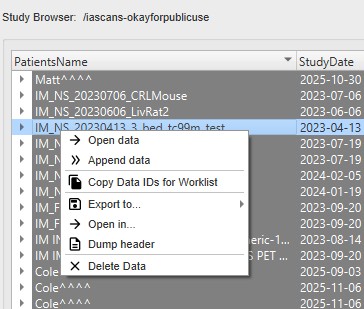
| Option | Description |
|---|---|
| Open data | Opens the selected data set in VivoQuant and loads it as the reference (see Open Reference). |
| Append data | Opens the selected data set in VivoQuant and loads it as an append data set (see Append Data). (only visible if a refernce image is already loaded) |
| Export to… | Allows data to be copied to a local folder or to another Data Browser or iPACS repository. |
| Open in… | Allows the data to be opened in an external Application. |
| Dump Header | Sends the file to the DICOM dump tool, which displays the information contained in the DICOM headers. |
| Delete Data | Deletes the resource from the repository source. |
Loading Data
The Loading Data section provides several functions for manipulating data, and opening.
| Apply default shift | If checked, a pre-defined shift will be applied to reconstructed SPECT data when it is opened. See Reorientation for more details on setting default shift values. |
| Auto-start reconstruction | If checked, CT and NM reconstructions will begin automatically when the Open button is applied to projection data in the Study Browser. |
| Force planar | If checked, it prevents interpolation from being performed on data with non-isotropic voxels. By default, data with voxel widths greater in the z dimension than in the x and y dimensions will be interpolated to have isotropic voxels when the Open button is applied. |
| Stack 3D | If checked, each 3D volume is loaded one on top of the other in a single series of images. If unchecked, each 3D volume is loaded in the same space, as a separate series. |
| Open Selected | Opens the data highlighted in the Study Browser. If a single data file is highlighted, it will be opened as the Reference image. If an entire Study is highlighted, the Open button recognizes which data file is the CT and sets it as the Reference. The Open button unloads data currently in VivoQuant and replaces it with the highlighted data. More information on the relationship between the Study Browser and the Open button can be found in the Study Browser documentation. |
| Append Selected | Appends the data highlighted in the Study Browser to the data sets already loaded into VivoQuant. For example, if two data sets are selected in the Data Browser and three data sets are already loaded into VivoQuant, then appending the two highlighted data sets will cause them to appear as data sets 4 and 5 in the Data Manager. Use the Open button to unload data currently loaded in VivoQuant and replace it with the highlighted data. |
Data Formats
By default, the Data Browser supports data with 1.* *.dcm *.dc3 *.dicom IM_* S_* 0* 1* 2* 3* 4* 5* 6* 8* 9* extensions. To edit this setting and configure loading in extension-less data from the Data Browser, navigate to the DICOM Settings page. For a complete list of formats, see Supported File Formats.
Progress
The Progress section of the Data Browser features a progress bar that shows the percentage of completion of the current process. Often is the case where there is 2 tiers of processing going on in the data browser; those involved in local processing and those involved in network communication. The progress bars attempt to reflect that in 2 separate bars. Where meaningful percentages cannot be calculated, an indeterminate (pulsing) progress bar is shown.
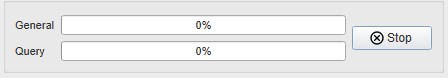
Click the ![]() button to cancel the current process.
button to cancel the current process.