The Near-Field Flood Uniformity (NFF QC) is a quality control procedure for monitoring the stability of the PMT gains for each head in the NanoSPECT/CT. To collect NFF QC data, please run the QC SPECT Near-Field Flood (NFF) protocol in the Configuration/QC Protocols panel of the Nucline software.
Getting There
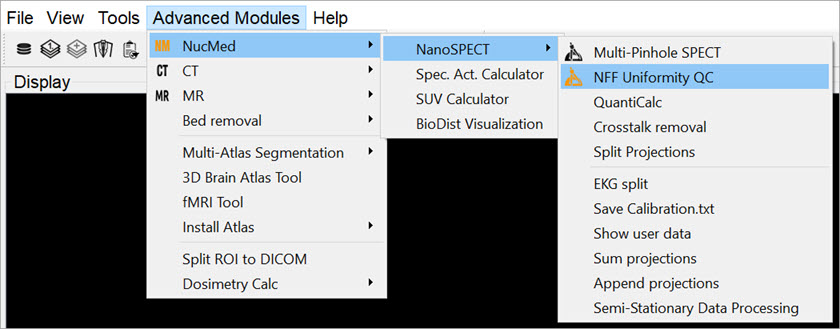
To gget to the Near-Field Uniformity analysis panel, go to Advanced Modules > NucMed > NanoSPECT.
Function
The Near-Field Uniformity tool analyzes NFF QC data for monitoring detector uniformity. To begin the procedure, use the QC SPECT Near-Field Flood (NFF) protocol to collect NFF QC data. Place ~0.5MBq of Tc-99m in as small a volume as possible in a PCR (Eppendorf) tube. Place this tube in the NFF phantom, a specially-designed holder for the Minerve bed. Center the point source in the object space as well as possible (using the images and countrates as a guide). Run the NFF Protocol, rotate 90-degrees, and run the NFF Protocol a 2nd time. Now that data are collected, they may be analyzed using the Near-Field Uniformity tool.
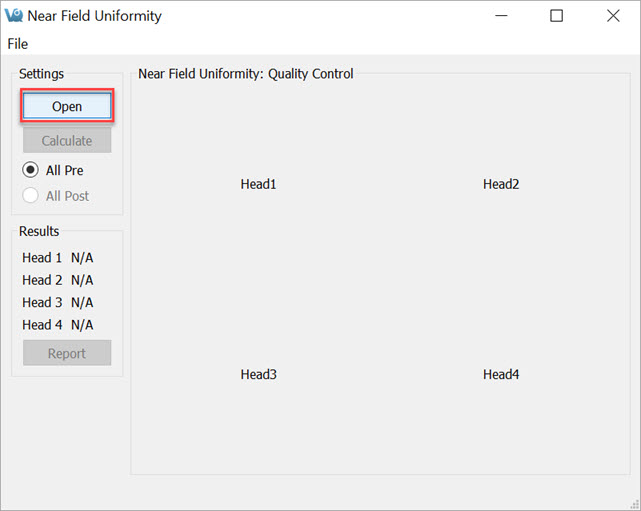
The initial NFF panel shows gray areas for each head and an array of buttons. To load the data, press the Open button.
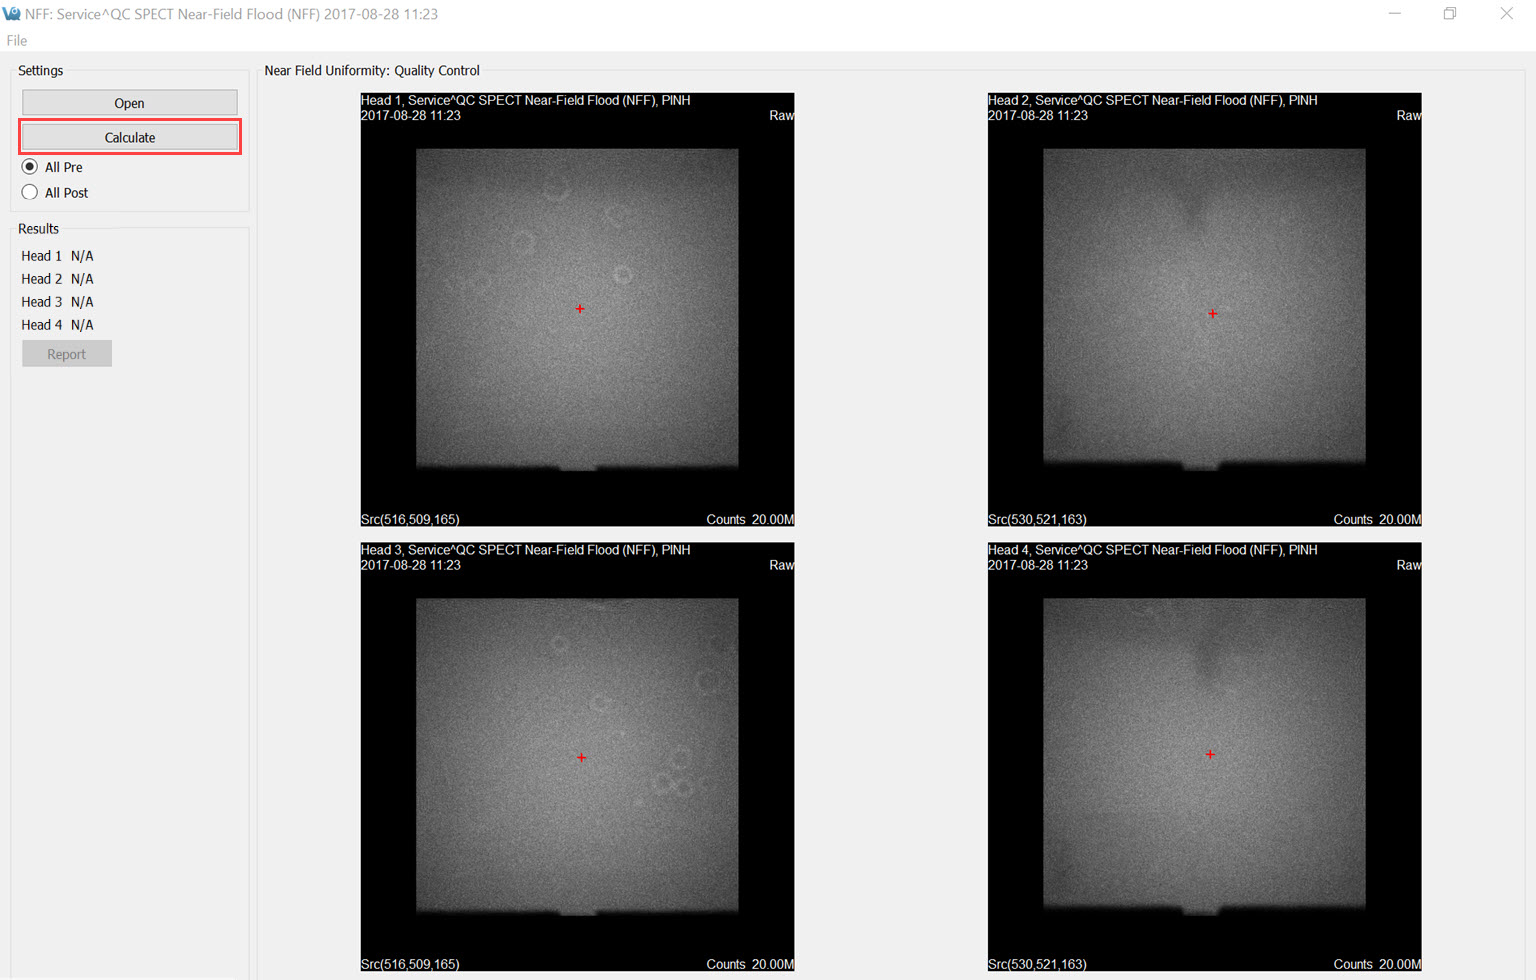
The data for each head will appear in the appropriate box. To run the analysis, press Calculate.
As the data are analyzed, the screen is grayed out. Progress can be monitored in the Results panel shown on the left.
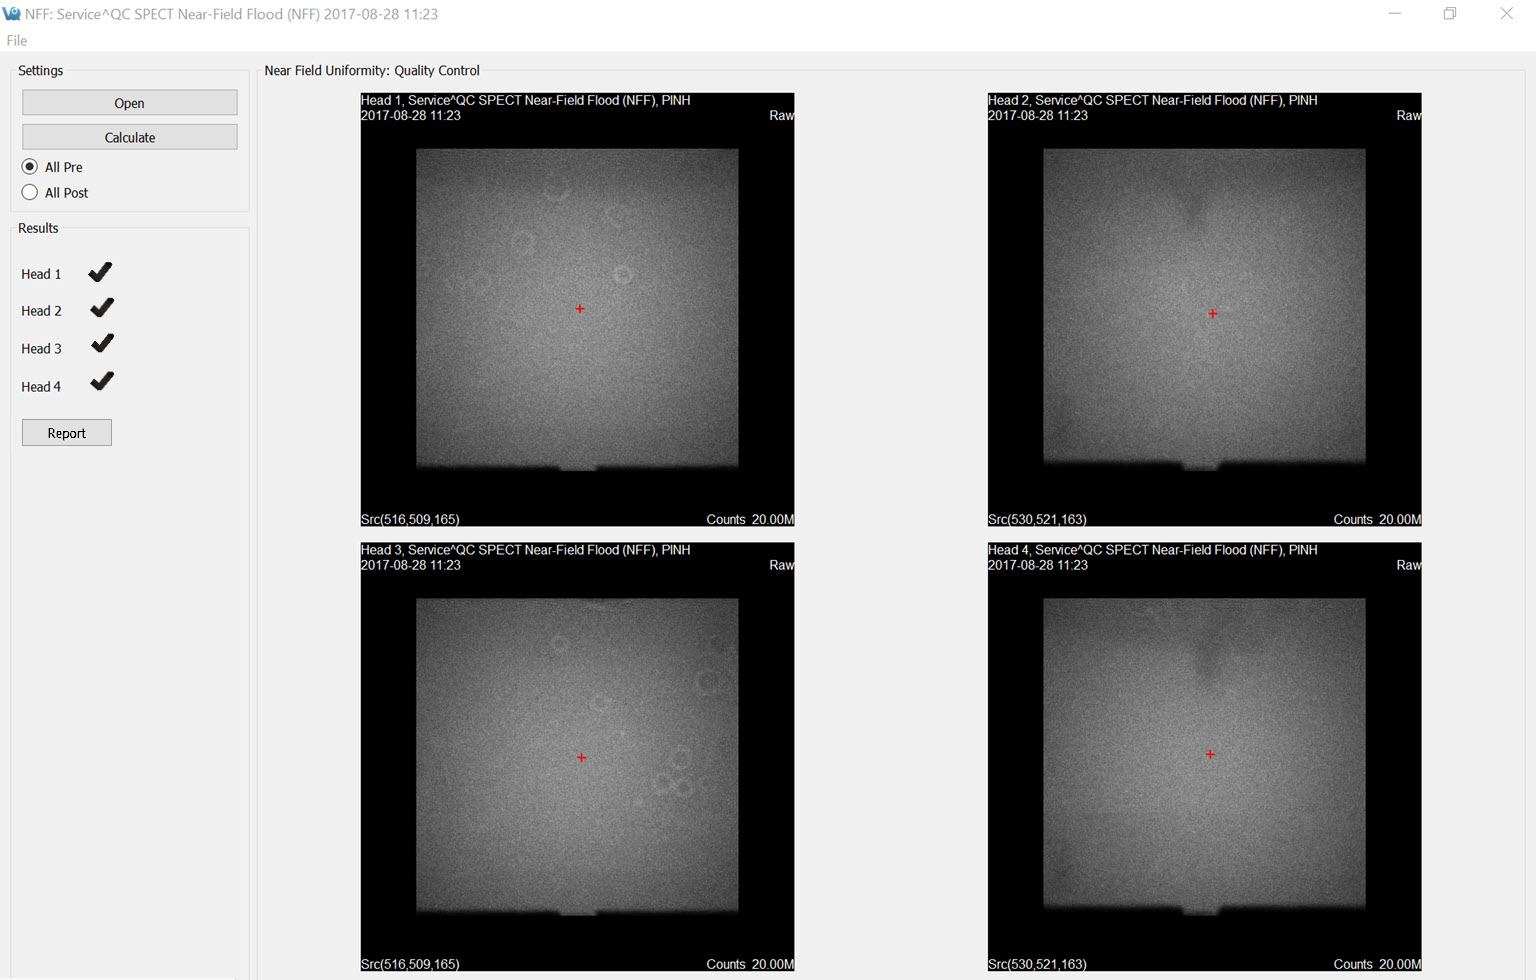
Once the data are analyzed, the (x,y,z) calculated source position will be displayed in the lower-left corner of each Raw image. These images are indicated by the appearance of the word Raw in the upper-right corner. Also, the raw images are displayed when the All Pre push-button is selected. The red plus sign on each image indicates the source position with respect to the detector.
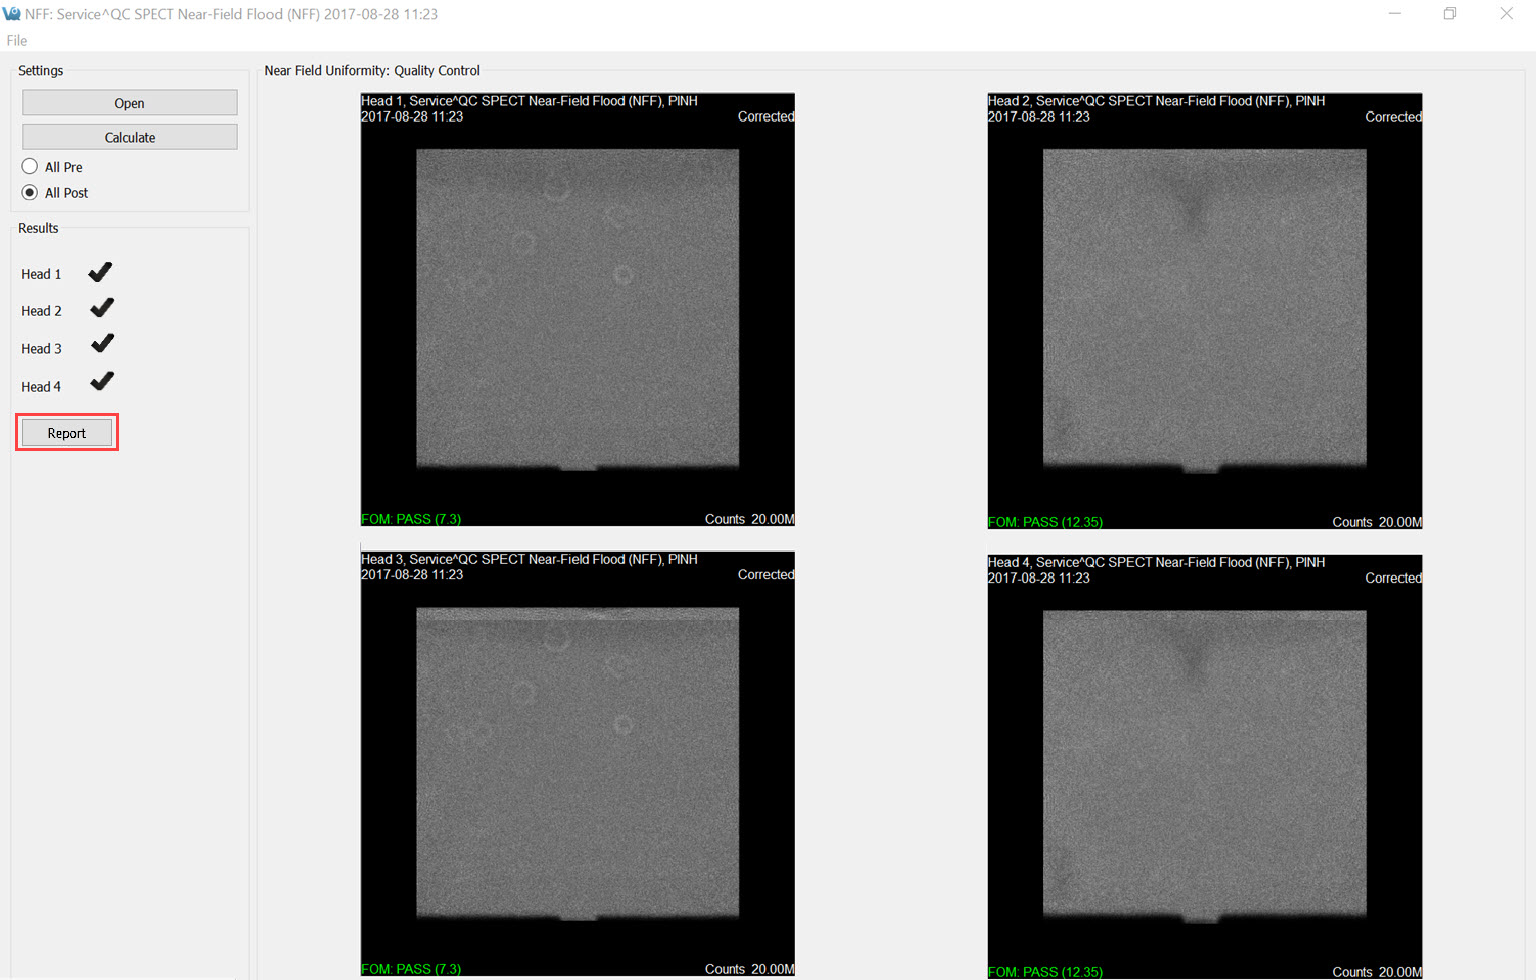
Viewed the corrected images by clicking the All-Post button. Use Ctrl+T to toggle between the two sets of images. The FOM for each data set is displayed in the lower left corner. A green checkmark in the Results section indicates that the head passed the calibration. A red FOM in the Results section means that the data are questionable and should be sent to a service engineer for further analysis. Finally, to create a PDF containing the pre- and post-correction images, press Report.