The Biodistribution Visualization tool creates an atlas representation of measured mouse biodistribution values.
Getting There
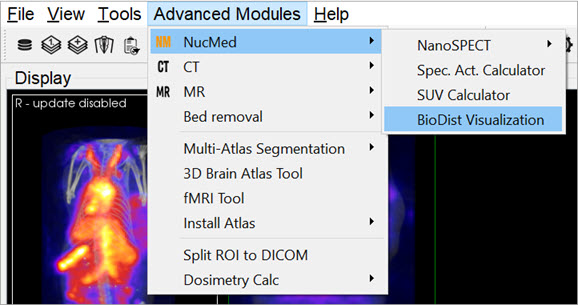
Biodistribution Visualization is accessible by going to Advanced Modules>NucMed>BioDist Visualization .
Function
To use the Biodistribution Visualization function, enter the total measured activity for each region-of-interest available in the atlas list.
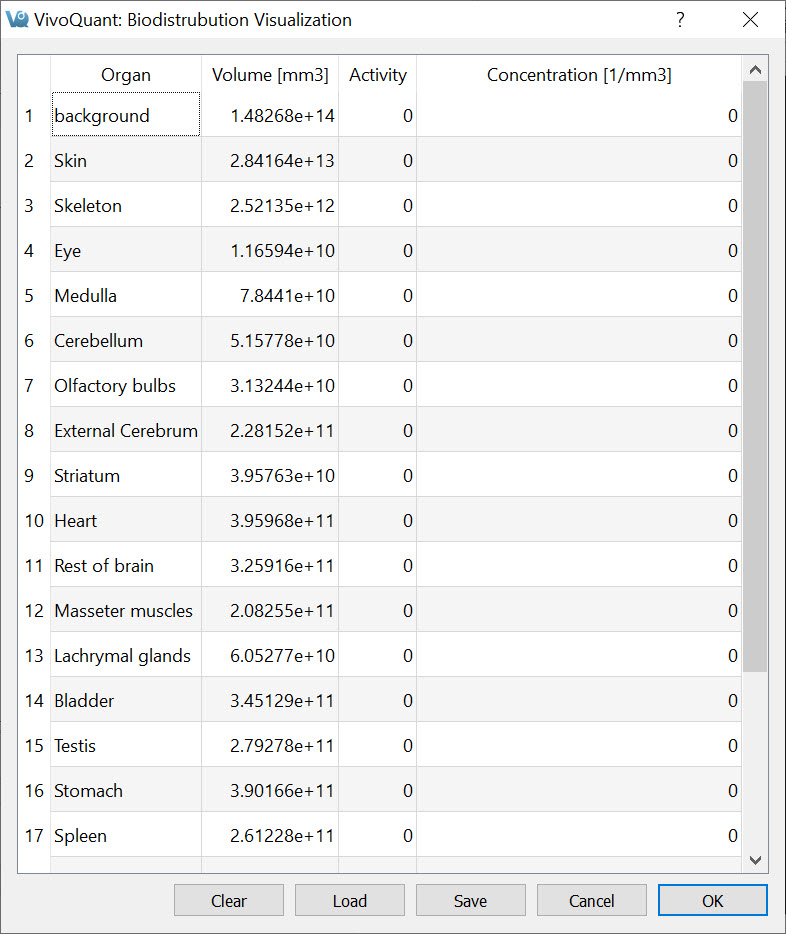
After entering the appropriate values, select one of the buttons at the end of the list.
| Button | Description |
|---|---|
| Clear | Clears all fields |
| Load | Loads a previously saved biodistribution text file. |
| Save | Saves the current biodistribution data into a text file. |
| Cancel | Closes the Biodistribution Visualization window. |
| OK | Prepares the atlas with the entered biodistribution information. |