The Min/Max Tool allows you to adjust the windowing of visible voxels for the first three Inputs.
Getting There
The Min/Max Tool is available via the Tools menu.
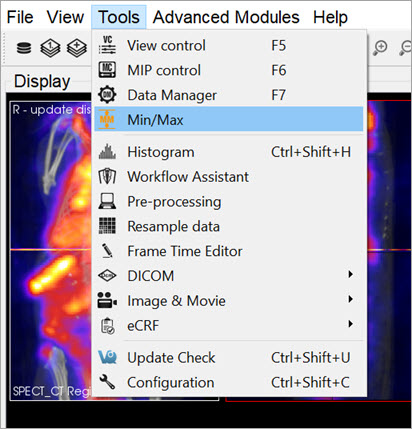
You can also access the Min/Max Tool by clicking on the Min/Max Tool thumbnail ![]() in the Main Window.
in the Main Window.
Function
The Min/Max Tool displays the windowing values with units for the Reference, Input 1 and Input 2. The Display Configuration determines whether the windowing is displayed based on Minimum/Maximum or Level/Width.
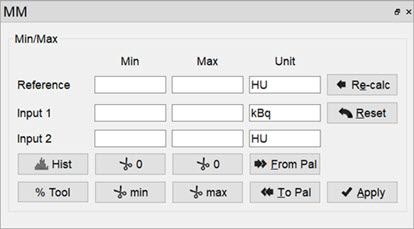
The windowing values allows you to calculate the colors for each voxel in the Display, via a mapping from voxel values to the colors in the color palette. Any values below the minimum will return the lowest color (e.g. black in the gray palette), while any values above the maximum will return the highest color (e.g. white in the gray palette).
The Min/Max Tool uses a cache feature, whereby minimum and maximum values for inputs are stored in a cache and used by the color mapping until the user forces the tool to recalculate them. This enables you to keep the color scale consistent when working with multiple datasets.
| Option | Description |
|---|---|
| Re-calc | Recalculates the min/max values for all data sets from the original data. Min/max value will be min/max voxel values in dataset. |
| Reset | Resets the min/max values to the values stored in the cache. |
| Apply | Stores min/max values in cache and applies values to the datasets. |
| From Pal | Copies the current palette window as set in the Data Manager to the Min/Max Tool fields. |
| To Pal | Copies the current Min/Max Tool fields to the palette window settings in the Data Manager. |
The buttons with the Cut icon ![]() will clip the data based on values in the tool. This can be useful when trying to clip dense bone from a CT scan, for instance, or background noise from a PT scan.
will clip the data based on values in the tool. This can be useful when trying to clip dense bone from a CT scan, for instance, or background noise from a PT scan.
| Option | Description |
|---|---|
| Sets all values below the minimum to 0. | |
| Sets all values above the maximum to 0. | |
 |
Sets all values below the minimum to the minimum. |
| Sets all values above the maximum to the maximum. |
Histogram
The Histogram button ![]() opens the Histogram Tool. This tool generates a histogram of voxel values in the loaded datasets. For more on this, visit the Histogram Tool page.
opens the Histogram Tool. This tool generates a histogram of voxel values in the loaded datasets. For more on this, visit the Histogram Tool page.
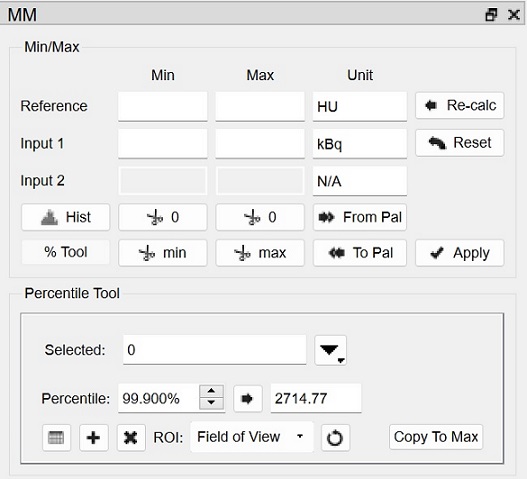
Percentile Tool
The Percentile button ![]() brings up the Percentile Tool, which calculates the pixel value associated with the Xth percentile from the histogram of the image.
brings up the Percentile Tool, which calculates the pixel value associated with the Xth percentile from the histogram of the image.
| Option | Description |
|---|---|
| Calculates the percentile value for selected image in the drop down list to the right. | |
| Shows percentile value with Patient Name, Patient ID, Acquisition Time, Percentile, Cutoff Value, and Units information from image metadata. | |
| Loads calculated percentile value into table. | |
| Deletes the selected row from the percentiles table. | |
| Resets the value in the ROI field to Field of View. | |
| Copies computed pecentile value to the Max value above. |