The Projection Tool provides a means to quantify density and activity parameters in CT and NM, MR, PET, or SPECT images. The tool provides several options for generating quantification data. There are multiple methods for setting the region of interest, flexibility in selection of the quantification view direction, easy-to-read presentation of data found in the Quantification Table, and options for saving and loading ROIs or plotting data.
Getting There
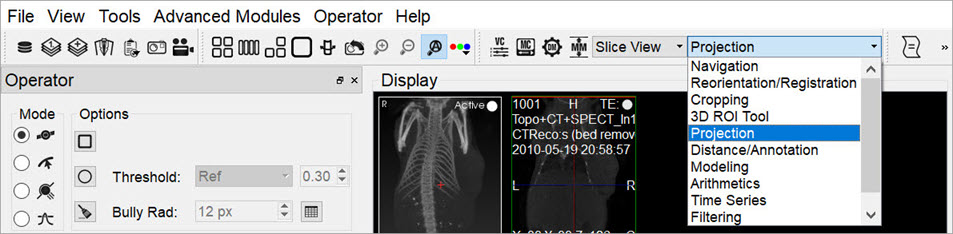
To access the Projection tool, use the View sub-menu in the Operator section of the main menu.
Using the Tool
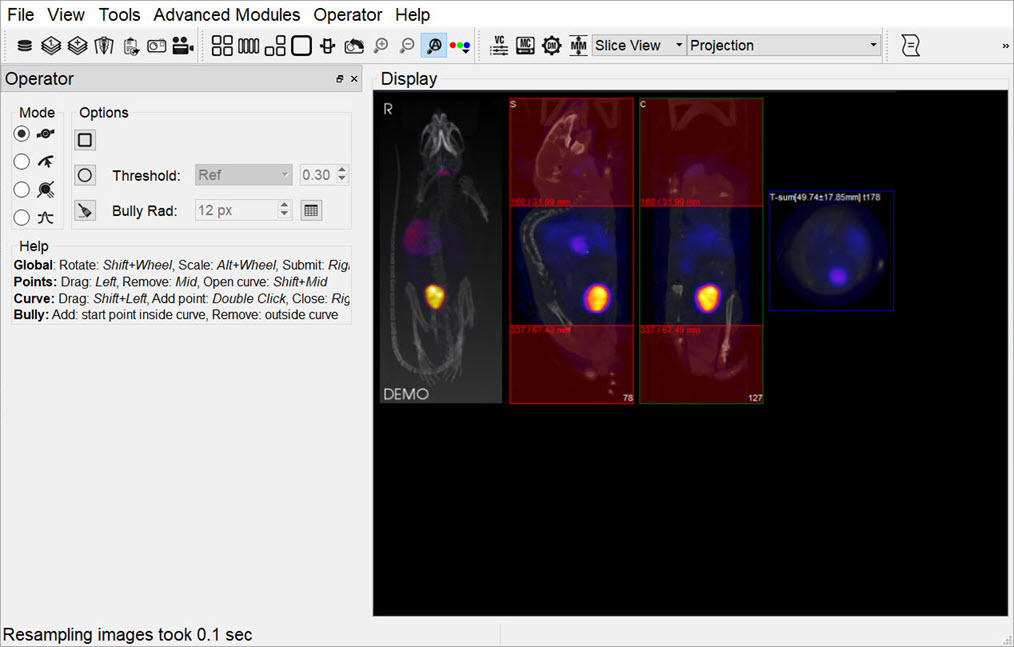
Upon selection of the tool, the Projection panel appears. The first step in using the projection tool is to define a Region-of-interest (ROI).
Choosing the View Direction
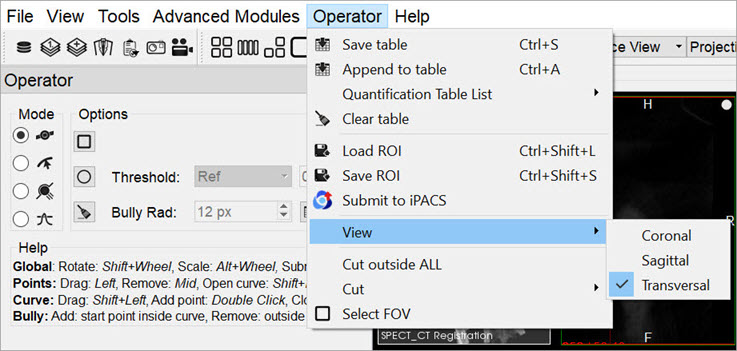
The ROI may be drawn in either the transverse (default), coronal, or sagittal plane. To toggle between these options, use the View menu in the Operator tab of the main menu.
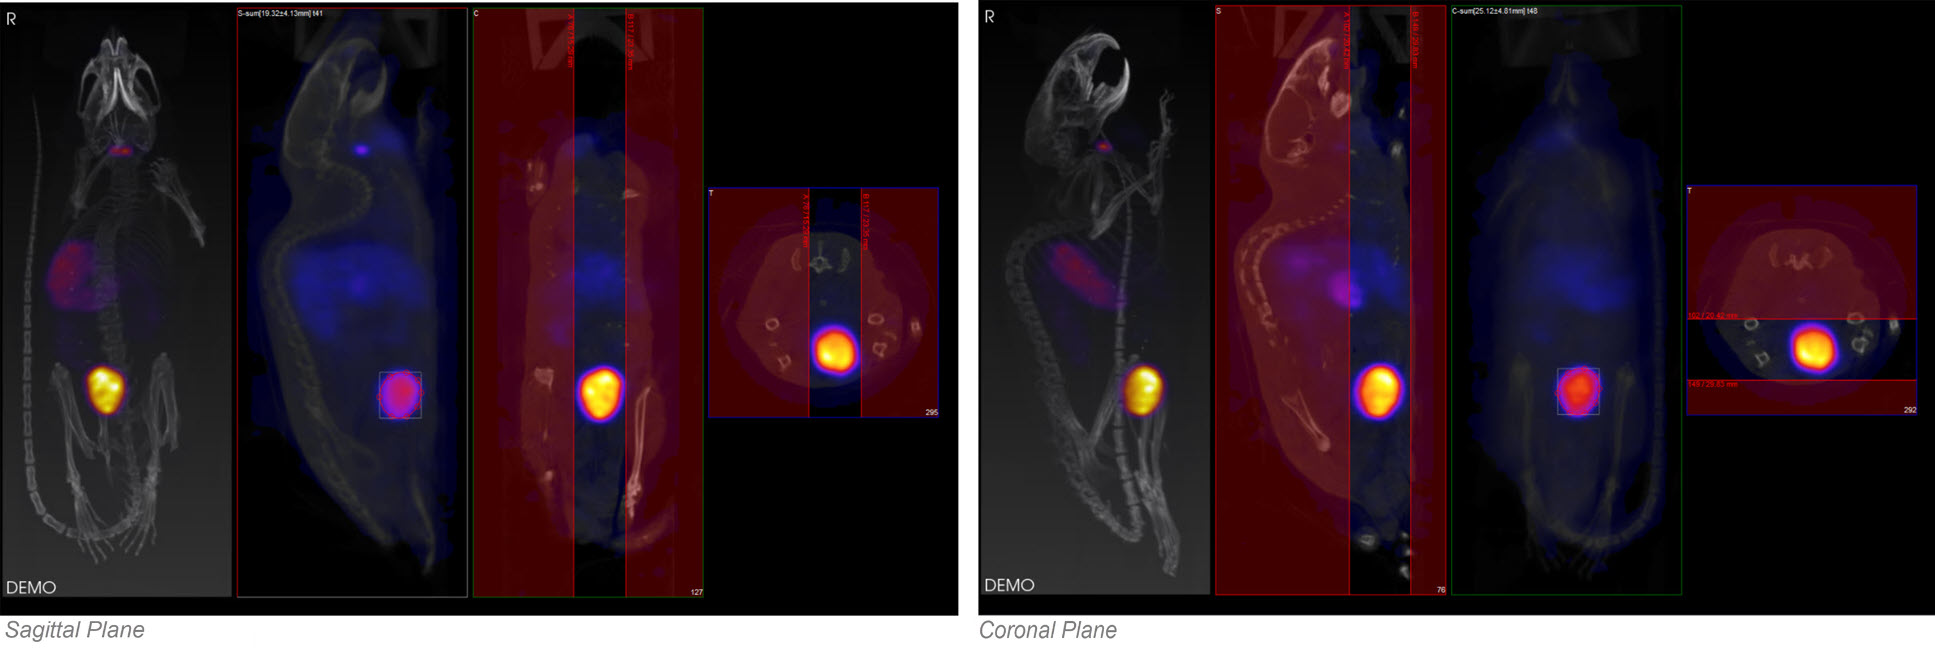
In this example, using the default settings, the axial sliders determine the extent of the ROI in the axial direction. The region or pre-defined shape described below determines the bounds of the ROI in the transverse plane.
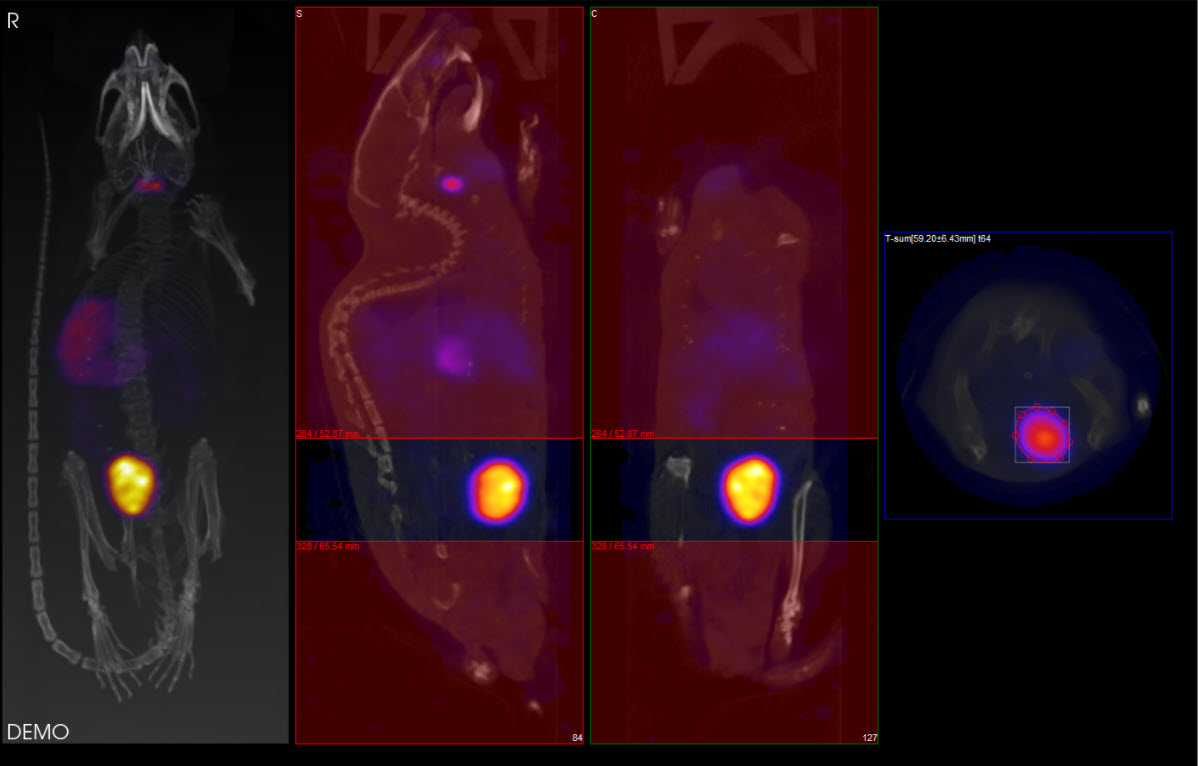
By using the View menu, it is also possible to draw ROI boundaries in the sagittal plane or coronal plane:
Choosing the ROI type
There are four ROI types, labeled as Modes:
| Spline | Points are defined, and smooth curves are drawn in between. The base points can be moved by using the left mouse button to drag them. Additionally, points can be deleted (middle click point) or added (double click position on curve). Once a shape has been closed (right mouse button), it can be re-opened by using Shift + middle click on a point. | |
| Freehand | A freehand region may be drawn by moving the mouse while holding down the left mouse button. The region may be drawn in segments through a series of left clicks of the mouse. | |
| Bully | Push lines out or into the object with a circle-shaped cursor. The size of the cursor is defined by setting the Bully Rad field in the Options section. This mode provides an efficient way to fine-tune an ROI made in Spline or Freehand mode. | |
| Threshold | A reference voxel is determined with a left click in the transverse window. The ROI is determined by finding the region of voxels surrounding the reference voxels that share similar values to the reference voxels. The threshold value establishes how near in value the boundary voxels must be to the reference voxel. |
Mouse Actions
| Action | Mouse Shortcut |
|---|---|
| Rotate ROI | Shift + mouse wheel |
| Scale ROI | Alt + mouse wheel |
| Move ROI | Shift + left click |
Once the desired ROI has been defined, click the Show Table button ![]() or right-click on the ROI to open the Quantification Table. This table contains a wide range of information, as described below.
or right-click on the ROI to open the Quantification Table. This table contains a wide range of information, as described below.
Click the Clear button ![]() in the Options section to clear the current ROI and begin drawing another.
in the Options section to clear the current ROI and begin drawing another.
VQ maintains the most recent ROI until a new ROI is defined. Each ROI for which data is collected is assigned a new color. Note, for example, that editing a ROI following data calculation results in a change to the color of the ROI. Also, the MIP reflects the currently selected ROI by shading the region encompassed by the ROI according to the appropriate color.
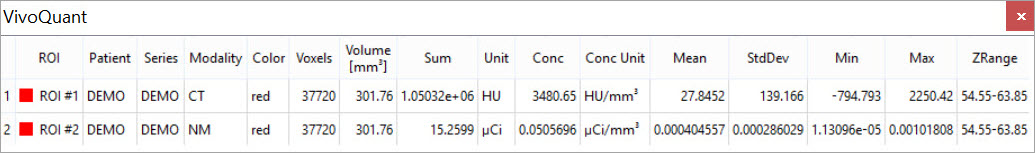
Quantification Table
After defining the ROI, the quantification table will fill the following fields.
| Field | Description |
|---|---|
| ROI | Name of the ROI. You can left-click this field to enter comments. |
| Patient | Patient’s name for the current study. |
| Series | Specific data set in the study from which the data was calculated. |
| Modality | Modality from which the data values for the row were calculated. |
| Color | Color of the ROI as drawn in the display. |
| Voxels | Total number of voxels contained in the selected ROI. |
| Volume [mm3] | Volume of the selected ROI in units of cubic millimeters. |
| Sum | Total amount of attenuation/activity in the selected ROI for CT and NM, MR, PET, or SPECT data sets, respectively. |
| Unit | Unit of voxels in the selected dataset. CT data use Hounsfield units (HU). You can specify the units used by SPECT data in the Data Panel of the Configuration Tool. Options include MBq, kBq, mCi, and µCi. |
| Concentration | Total amount of attenuation/activity in the selected ROI for CT and NM, MR, PET, or SPECT data sets, respectively, divided by the ROI volume. |
| Conc Unit | Unit of voxels in the selected data set over volume. CT data use Hounsfield units (HU/mm^3). You can specify the units used by SPECT data in the Data Panel of the Configuration Tool. Options include MBq/mm3, kBq/mm3, mCi/mm3, and µCi/mm3. |
| Mean | Average amount of attenuation/activity in the selected ROI. |
| StdDev | Standard deviation is a measurement of the variability in attenuation/activity in the selected ROI from voxel-to-voxel. The smaller this value, the more uniform the distribution of attenuation/activity in the ROI. |
| Min | Minimum attenuation/activity value of the voxels in the selected ROI. |
| Max | Maximum attenuation/activity value of the voxels in the selected ROI. |
| ZRange | Distance spanned by the axial sliders specified via slice numbers. |
Quantification Table Options
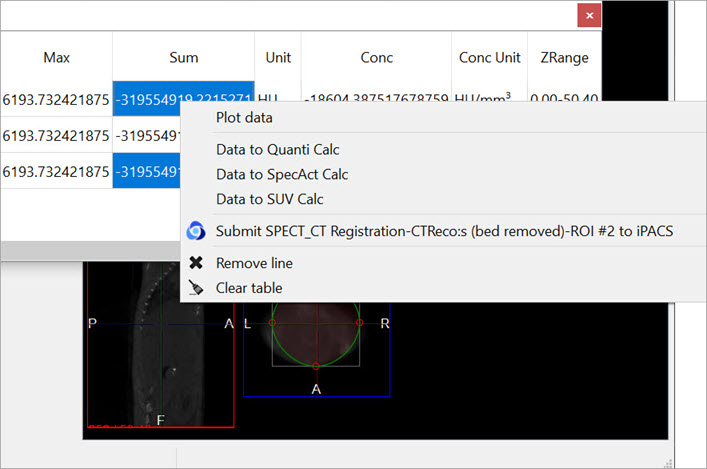
Right-click on one or more entries in the Quantification table to view the following options:
| Menu Item | Description |
|---|---|
| Plot data | Plots the selected data on a line graph. |
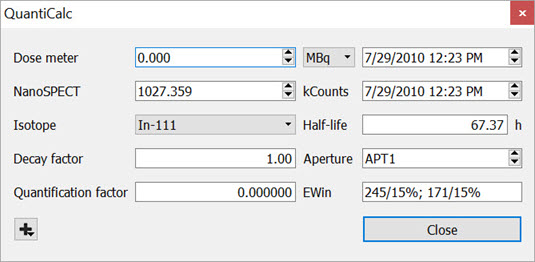
| Data to Quanti Calc | Calculates the Quantification factor with the acquired data. |
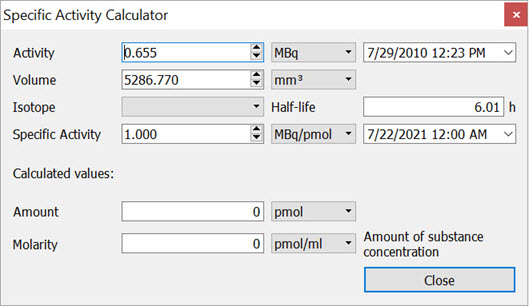
| Data to SpecAct Calc | Calculates the specific activity with the acquired data. |
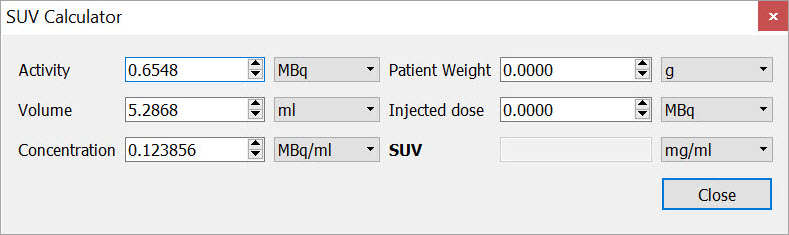
| Data to SUV Calc | Calculates the standarized uptake value with the acquired data. |
| Submit ROI #* to iPACS | Submits #* ROI (the selected ROI) to iPACS. |
| Remove line | Deletes the entire row of the corresponding selected cell. |
| Clear table | Deletes all information from the table, but not permanently. The table can be reopened by right-clicking and the data for the corresponding selection will reappear. |
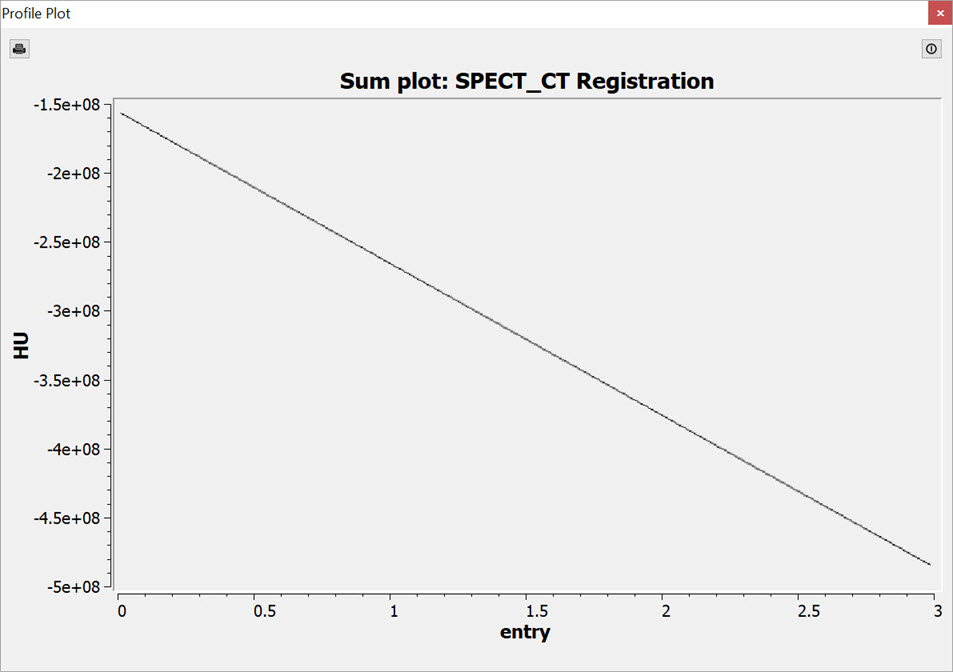
Plot data
It is possible to plot the quantified data. This function is useful to look at changes in activity, concentration, volume, etc., particularly in gated, dynamic, and longitudinal studies.
To plot data from the quantification tool, select the column of interest (i.e., Sum, Mean, etc.), right-click on any element in the column, and then select Plot Data.
The plotted data will open in a new window and may be saved into an output PDF file.
Data to Quanti Calc
The calculator will automatically import the associated data.
Data to SpectAct Calc
The calculator will automatically import the associated data.
Data to SUV Calc
The calculator will automatically import the associated data.
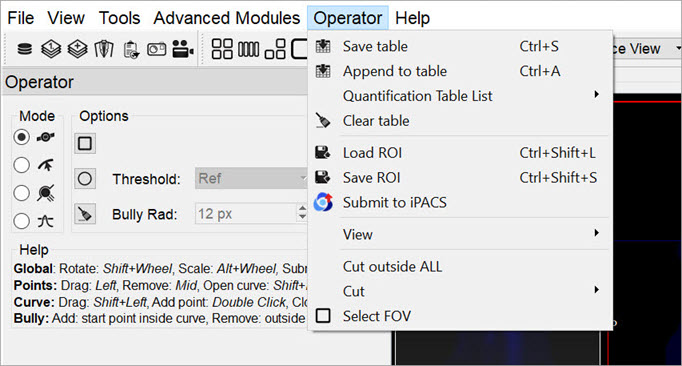
Operator Menu
The Projection operator also provides several options for saving quantification and ROI information, as well as viewing and cutting options, and miscellaneous ROI functions. To access these options, click on the Operator section in the main menu.
| Menu Item | Description |
|---|---|
| Save table | Saves the current Quantification table to a local file. Accepted formats include .csv, .txt, and .xls. |
| Append to table | Appends the current Quantification table to a previously saved table. |
| Quantification table list | Allows users to choose what fields to be displayed in the Quantification table. |
| Clear table | Clears the current Quantification table. |
| Load ROI | Loads a previously saved ROI. |
| Save ROI | Saves the current ROI as a .roi file. |
| Submit to iPACS | Submit the quantification data as a Data Point to the associated image on the iPACS. |
| View | Allows users to choose the ROI view direction. |
| Cut outside ALL | Clears all voxels outside the ROI within the currently selected slices, and all voxels outside the currently selected slices. Slices outside the set axial range will be cleared entirely. |
| Cut | Clears all voxels inside/outside the ROI within the currently selected slices, depending on which direction (inside/outside) is selected. Slices outside the set axial range will not be affected. - Apply ROI to all slices: Applies the ROI to every slice in the image. |
| Select FOV | Creates a new ROI entry representing the field-of-view (the entire volume of the image). The quantification table will be populated with this entry, labelled as FOV. |
| Copy table | Copies the data in the Quantification table to the clipboard. |
| Close | Closes the Quantification panel and returns the VQ to the Navigation screen. |