VivoQuant’s Main Window contains the primary display and is the focal point for reaching all other functions.
Menus
There are five menus across the top of the Main Window:
| Menu | Function |
|---|---|
| File | Used for file manipulation and includes options for opening, saving, printing, and publishing files. |
| View | Used to control the display of data already loaded into the VQ. Entire data sets may be toggled as may a variety of display options, including layout and zoom. |
| Tools | Provides access to several VQ image processing tools, including data control, reconstruction, calibration, and configuration features. |
| Advanced Modules | Provides access to more advanced VQ image processing tools, including data control, reconstruction, calibration, and configuration features. |
| Help | Help content, including licensing information and the manual, are available in this menu. |
Docks
The View Control, MIP Control, Data Manager, and Operators are automatically placed into Docks upon opening. Docks may be dragged and dropped into and out of the Main Window display, and multiple controllers/operators are dockable at any given time.
Thumbnails
The thumbnail icons described below provide fast access to different features:
| Thumbnail Icon | Function |
|---|---|
| Opens the Data Browser | |
| Opens a browser that will unload currently loaded data and replace it with the data selected in the browser. | |
| Opens a browser that will append data to currently loaded data. | |
| Opens the Save Image window. | |
| Opens the Save Movie window. | |
| Changes the display layout to a 2 x 2 grid layout. | |
| Changes the display layout to a 1 x 1 grid layout. | |
| Changes the display layout to show the sagittal, coronal, and transverse data slices but not the MIP. | |
| Changes the display layout to show only the transverse data slices. | |
| Changes the display layout to show only the MIP. | |
| Resets the zoom and pan within each viewport in the display. | |
| Zooms in 25%. | |
| Zooms out 25%. | |
| Auto-zooms to fit data to screen. | |
| Opens RGB color options. | |
| Opens the Viewer Control panel. | |
| Opens the MIP Control panel. | |
| Opens the Data Manager panel. | |
| Opens the Min Max Tool panel. | |
| Opens the VivoScript Evaluation window. | |
| Edits the VivoScript file selected in the Quick Scripts menu. | |
| Evaluates the VivoScript file selected in the Quick Scripts menu. | |
| Aborts the VivoScript in execution. | |
| Activates the Peek tool, used to reveal names of operator widgets for use in VivoScripts. See the VivoScript page for more. |
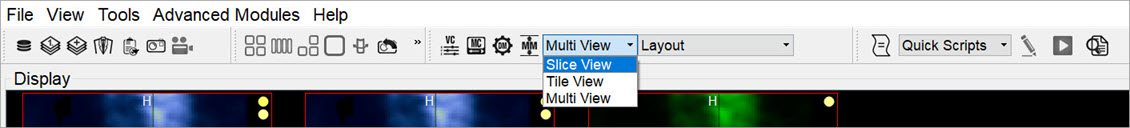
View Modes
There are three viewing modes available via the pull-down menu located next to the thumbnail icons.
| View Mode | Function |
|---|---|
| Slice View | The Slice View (default) simultaneously displays images of single slices for the MIP, sagittal, coronal, and transversal views of the loaded data sets. |
| Tile View | The Tile View displays an array of slices for either, sagittal, coronal, or transversal view of the loaded data sets. |
| Multi View | The Multi View displays sagittal, coronal, or transversal slices of each data set adjacent to one another simultaneously. |
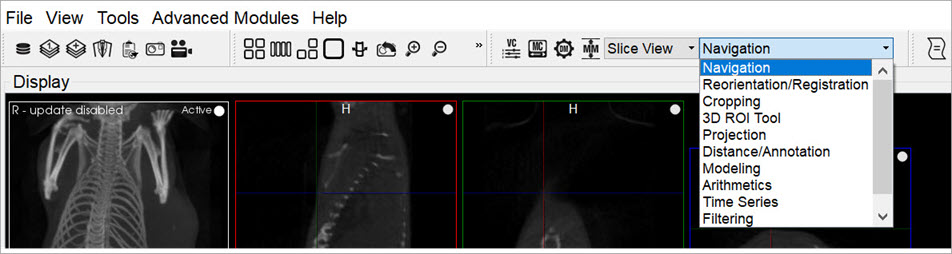
Operators
The operators are accessible via the pull-down menu located next to the thumbnail icons.
| Operator | Function |
|---|---|
| Navigation | Enables manually scrolling through the image slices and rotation of the Maximum intensity Projection (MIP). |
| 3D ROI Tool | Provides advanced tools for drawing, visualizing, saving, and quantifying both 2- and 3-dimensional regions. |
| Projection | Provides a means to quantify density and activity parameters in CT and NM scans, respectively. |
| Reorientation/Registration | Enables realignment of image data via translation, rotation, or flipping. In registration mode, a variety of registration algorithms are available to automatically register data from a wide variety of modalities. |
| Time Series | Allows sagittal, coronal, and transverse slices of datasets from a time series to be played sequentially in a loop or easily scrolled through manually. |
| Distance/Annotation | Allows you to measure the distance between two points in any image. |
| Checkerboard | In checkerboard mode, the reference and input data set(s) are arrayed in a pattern of alternating squares, resembling a checkerboard. |
| Cropping | Allows images to be made smaller by removing any unwanted areas. |
| Arithmetics | Allows voxel-wise arimethic operations on two input images, or scalar operations on any number of input images. |
| Filtering | Uses a selection of built-in smoothing filters with configurable parameters. |
| Modeling | Provides an integrated solution for representing the loaded data set with one of several mathematical models to allow for predictions and analysis. |
| Splitting | Provides utility to split the image into a number of distince regions. |
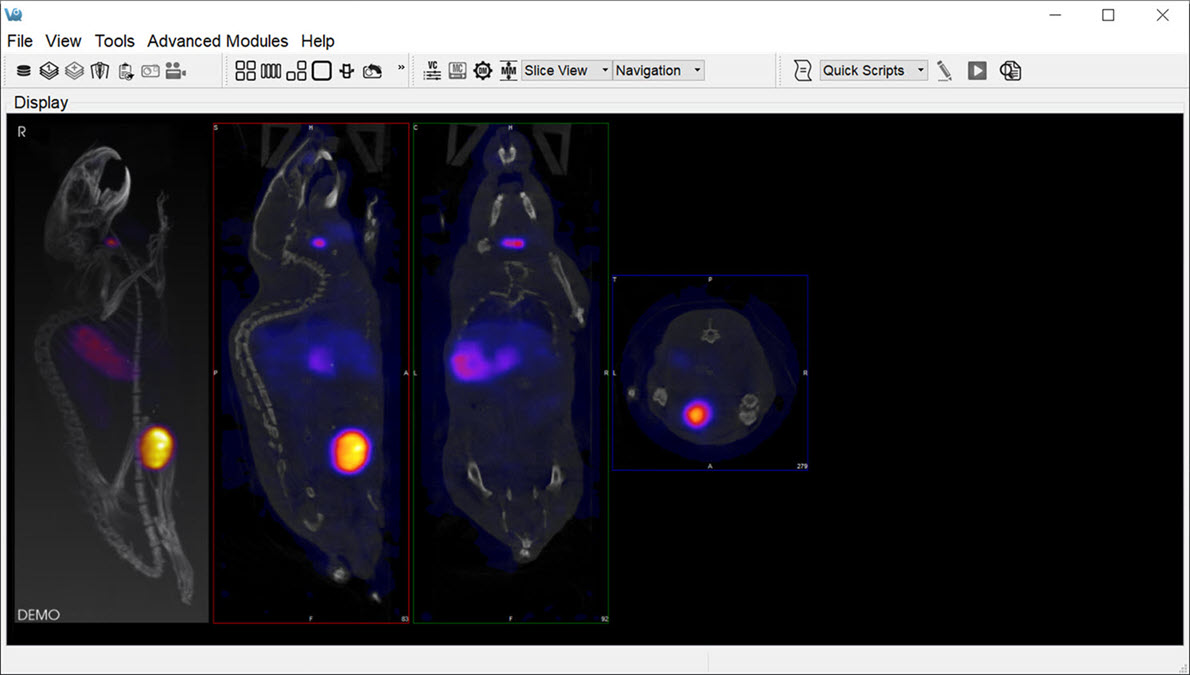
Display
The Display field is the main component of the Main Window. The first three images loaded in the Data Manager are visible in the Display field. Many tools and image-processing steps are visible in the data sets shown in the Display field.
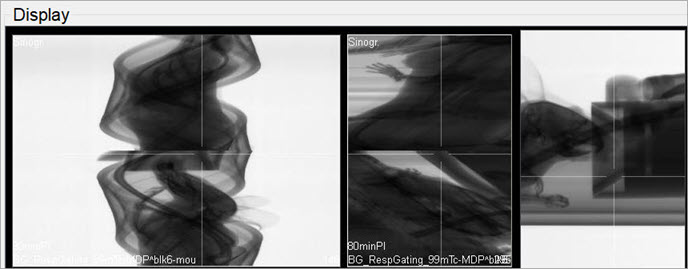
Projections vs. Reconstructions
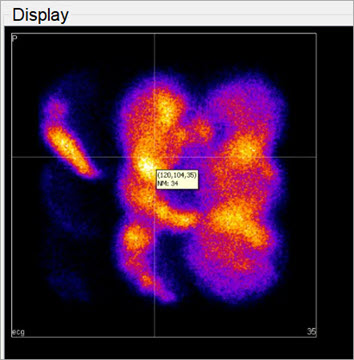
The Display window recognizes whether a loaded data set is projection data or reconstructed data. The default viewing scheme, known as Slice View, for reconstructed data includes an MIP and three separate viewing directions (sagittal, coronal, and transversal). When viewing projection data or sinograms (sets of CT projection data), VivoQuant displays the data accordingly. For example, transverse slices of projection data are displayed with a P in the top-left corner.
For CT data, selecting the correct layout will display the relevant sinogram data. For the corresponding windows, the data are labeled as sinogr., denoting “sinogram”.