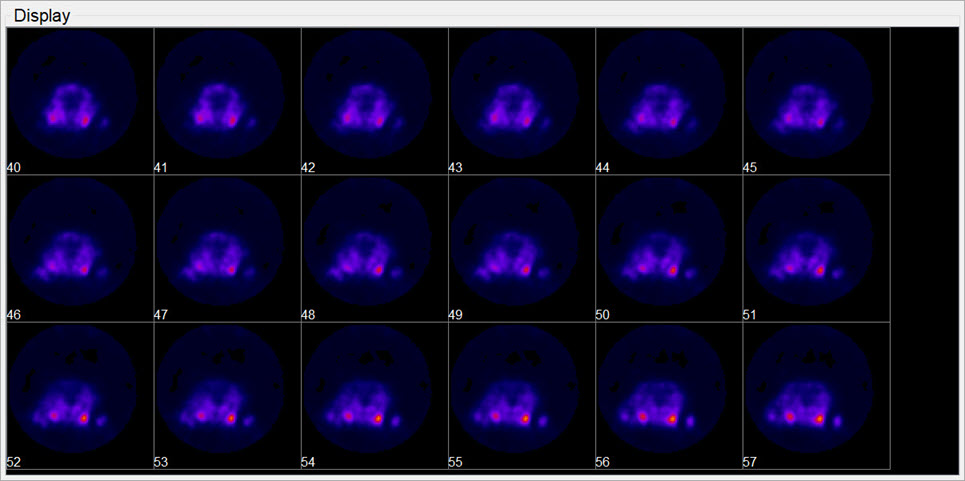
The Tile View displays an array of slices for either sagittal, coronal, or transversal view of the loaded data sets. The number of slices displayed depends on the size of the VivoQuant window.
Getting There
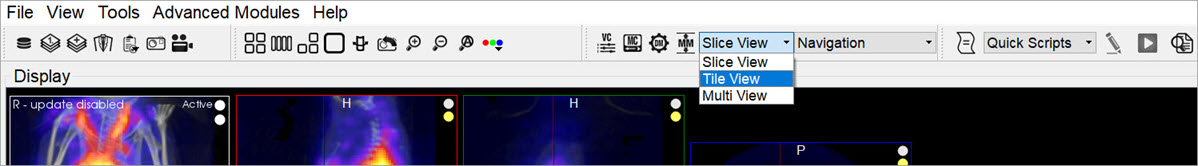
The Tile View is available via a pull-down menu on the Main Window.
Using the Tile View Display
You can scroll through slices in the Tile View using the scroll wheel on a mouse or using the arrow and paging keys on your keyboard. The keys control the rate at which the user scroll through the tiles.
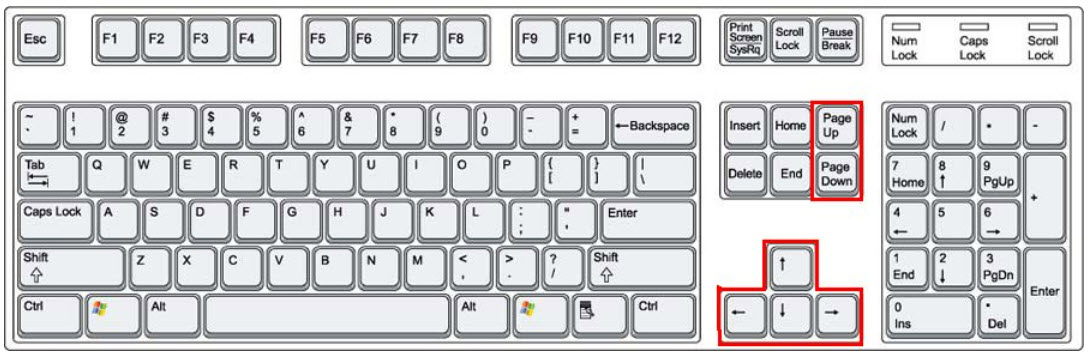
| ← | → | ↑ | ↓ | PageUp | PageDn |
|---|---|---|---|---|---|
| Previous slice | Next slice | Previous row | Next row | Previous screen | Next screen |
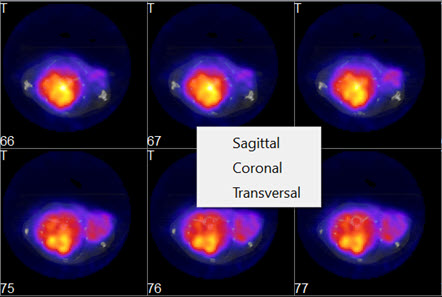
To switch between views (coronal, sagittal, transversal) in the Tile View, right-click on a tile and choose the desired view.
There are two operators available in Tile View. The Time Series operator, which enables dynamic data to be viewed as a time series, and the 3D ROI Tool operator, which enables ROIs to be displayed in Tile View.