The Histogram tool is used to plot a histogram of the voxel values in a loaded data set.
Getting There
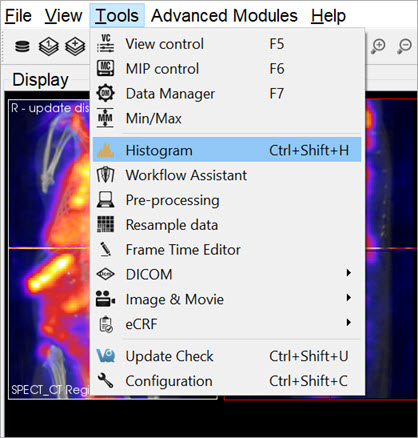
The Histogram tool may be reached via the Tools Menu or by using the keyboard shortcut Ctrl+ Shift+H.
Function
The Histogram tool is operated via two control panels: Data Controls and File Controls.
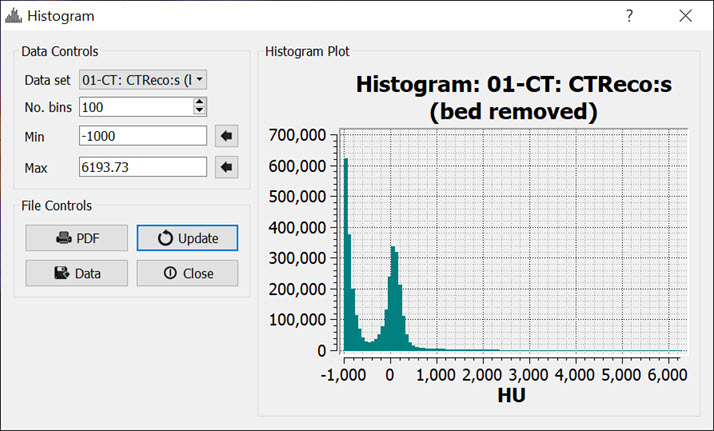
Data Controls
| Option | Description |
|---|---|
| Data Set | This pulldown menu allows the selection of the data set to be histogrammed. |
| No. bins | Sets the number of bins into which to divide the data. |
| Min | Sets the minimum value for which data will be displayed. The Set button, |
| Max | Sets the maximum value for which data will be displayed. The Set button, |
File Controls
| Option | Description |
|---|---|
| Saves the existing plot into a PDF file. | |
| Writes the data into a text file. The format is in two columns with the first column representing bin center points (x-axis values) and the second column representing the number of voxels in each bin (y-axis values). | |
| Refreshes the histogram plot. Use this button after changing the No. bins, Min., or Max. values. | |
| Exits the Histogram Tool. |